Analyzing Video Responses: Qualitative Data Analysis
Your Study Results
By far the hardest part of the qualitative research study process is analyzing the incoming data because it’s unstructured compared to quantitative data. Researchers appreciate our platform’s unique tools, which speed up the process and give researchers a head start. Leverage our six key features and learn how our proprietary Fabric AI can help.
Six Fabric features for qualitative data analysis

1. Video responses are organized by question
- You can hyper-target your analysis by reviewing how all respondents answered any one question.
- Unlike focus groups or moderated one-on-ones, the same questions get asked of everyone in the same order, providing consistency.
- Sometimes a specific question is THE question you’re trying to understand, and the other questions lead up to it. In that case, you can skip right to a specific column of responses, to get straight to the heart of the issue.
2. Enhanced transcript experience
- If you upgraded to human + machine transcripts (from machine only), then those transcripts will populate within 24 hours of each respondent’s completion.
- Google Speech transcripts are available to all researchers almost immediately. Note that while machines are good and getting better all the time, they aren’t perfect. We make the transcript field editable so that you can correct any Google Speech errors.
- Transcripts can be downloaded to Google Sheets or Excel.
3. Comments can be added to individual study responses
- As on any social media platform, there is a comment field where collaborators can share feedback, ideas and insights. The field can also be used for note-taking.
4. Respondents can be rated
- Our rating system makes it easy to remember who the best respondents are. It’s also a way to keep track of which respondents the researcher has reviewed.
5. Respondent names can be made anonymous
- In an era of increased sensitivity to PII, our default view is to make users’ names or email addresses anonymous. However, if you bring your own recruits, the default is to show respondents’ email addresses because we presume they gave you access to email them. That field is editable if you would like to make respondent names anonymous yourself.
6. Unlimited tags can be created
- There is no limit on the number of tags that can be created in a study.
- After tags are created, researchers can sort by tags individually or in combination.
Working with our proprietary Fabric AI
One of the top frustrations of qualitative data analysis is the time it takes to digest the information, make sense of it, and bubble up key insights.
So we developed our own proprietary sentiment and emotion-based AI that provides three primary data analytic sources that free up researchers to spend more time developing insights that link to their brand, message, product or design.
Fabric AI includes:
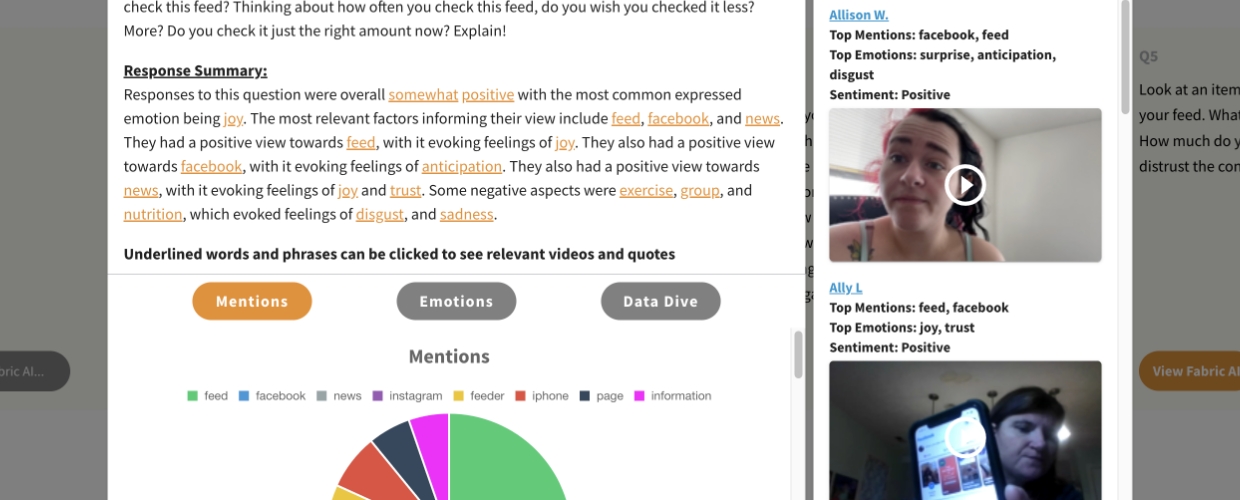
The paragraph summary
The paragraph summary encapsulates the responses to any individual question in a study. To be clear: this does not summarize metadata across the entire study, only question by question.
The paragraph is written in plain English and it identifies:
- Whether responses were positive, neutral or negative
- Up to three sources of the sentiment
- Key themes
- Top emotions
Sentiment, sources of the sentiment, themes and top emotions are all hyperlinked. The videos and verbatims surfaced by our AI respond to the topic being explored in the hyperlinks.
Total mentions & emotional mentions
Fabric AI shows a count of total mentions, as well as mentions with emotional intent behind them (either positive or negative).
- Total mentions is a count of literally how many times a word was mentioned.
- Emotional mentions is a count of how many times a word was mentioned with emotional intent behind it.
- Strength bar indicator shows whether the sentiment was strong or weak.
- Mentions are also correlated to one of 8 primary emotions Fabric AI tracks.
Additional features
Researchers also benefit from our AI’s ability to surface videos and verbatims with the highest degree of emotion, and there is a search field to quickly direct researchers to specific terms of interest.