How W+K used Fabric to understand sports fans, quickly
Problem
W+K was invited to pitch MLB, in part for its long time credentials working with Nike, in part because of its experience working for ESPN in the past, and in part because of its ability to understand how to leverage brands in a way that imbues them with meaningful cultural connections.
Like most pitch situations, the agency needed quick-turn qual with a limited budget:
- A national sample
- Gen Z – including a subset of Latinx and Spanish speaking respondents
- Sports fans (who play and watch sports generally) whom the League was trying to bring into the fold
- Baseball fans (who play and watch baseball regularly) who would provide the core baseball audience POV
The agency had some initial strategic themes they wanted feedback on, with the goal being:
- To understand how the themes resonate with consumers
- To see if any had an adverse impact
- To see if any new, unexpected themes surfaced
Solution
The account planner – Anthony Holton – turned to Fabric’s mobile video ethnography platform to get the job done in days versus weeks that traditional qual takes, and leveraged it in a number of ways:
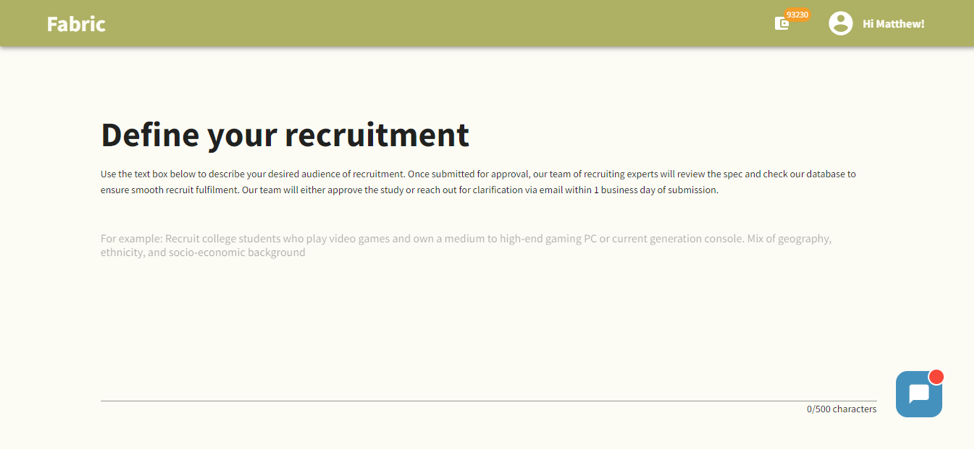
Pinpoint accurate recruitment: The platform can recruit respondents from its proprietary database, and to make things simple; all he had to do was type the specs into an open field, and Fabric created the screener, then added qualified participants to his study
Emotional AI-Automation: He opted for a sample size of n=15 because that’s the minimum threshold for Fabric AI to serve as an automated research assistant (more on that below)
SaaS Platform: Anthony crafted his own study questions (up to 10 Qs/respondent) and typed them in to the study builder
Simple stimulus uploading: He added stimulus (links to PDFs…as simple as adding links to a Google Doc) in a few of the study questions to get participant feedback on the strategic territories they were exploring
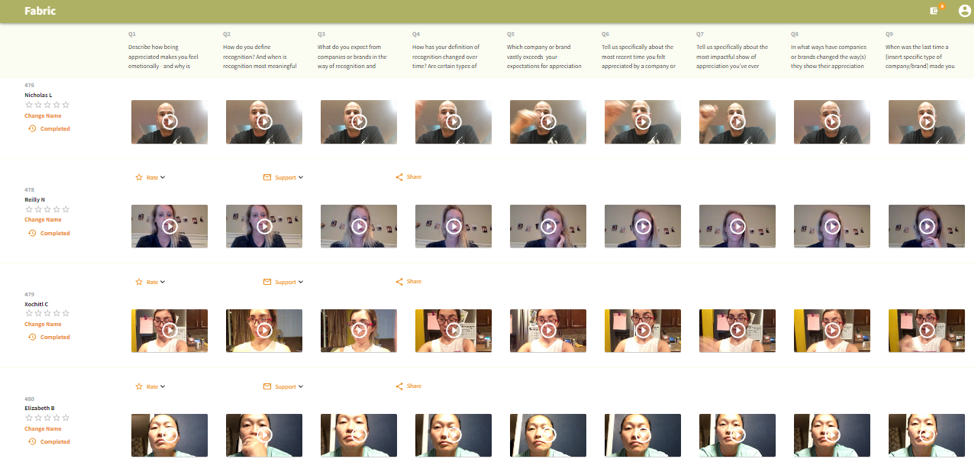
Intuitive Online Dashboard: As respondents completed, he used the study dashboard to review incoming responses:
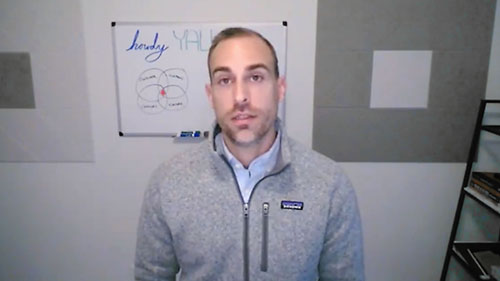
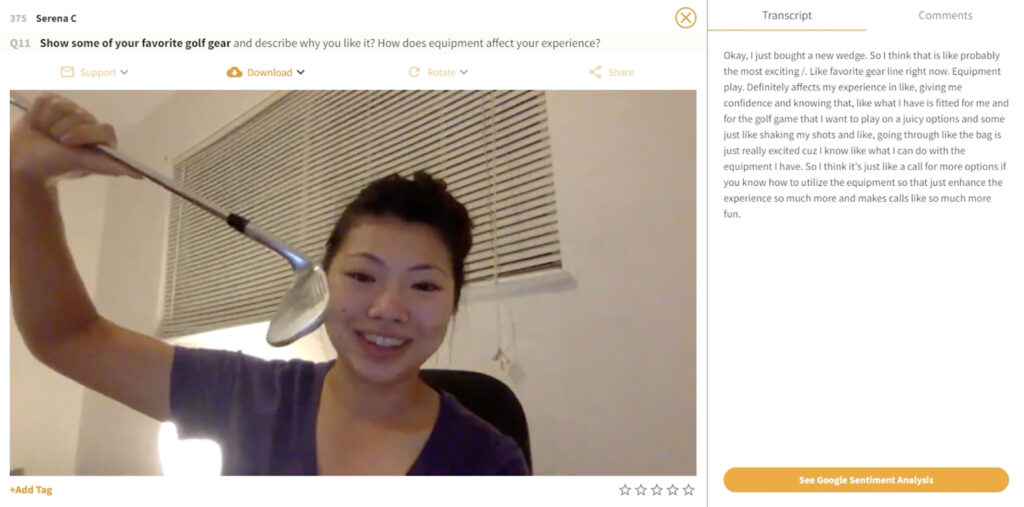
1. Each response is a self-recorded video up to 60 seconds long
2. Each response comes with transcripts
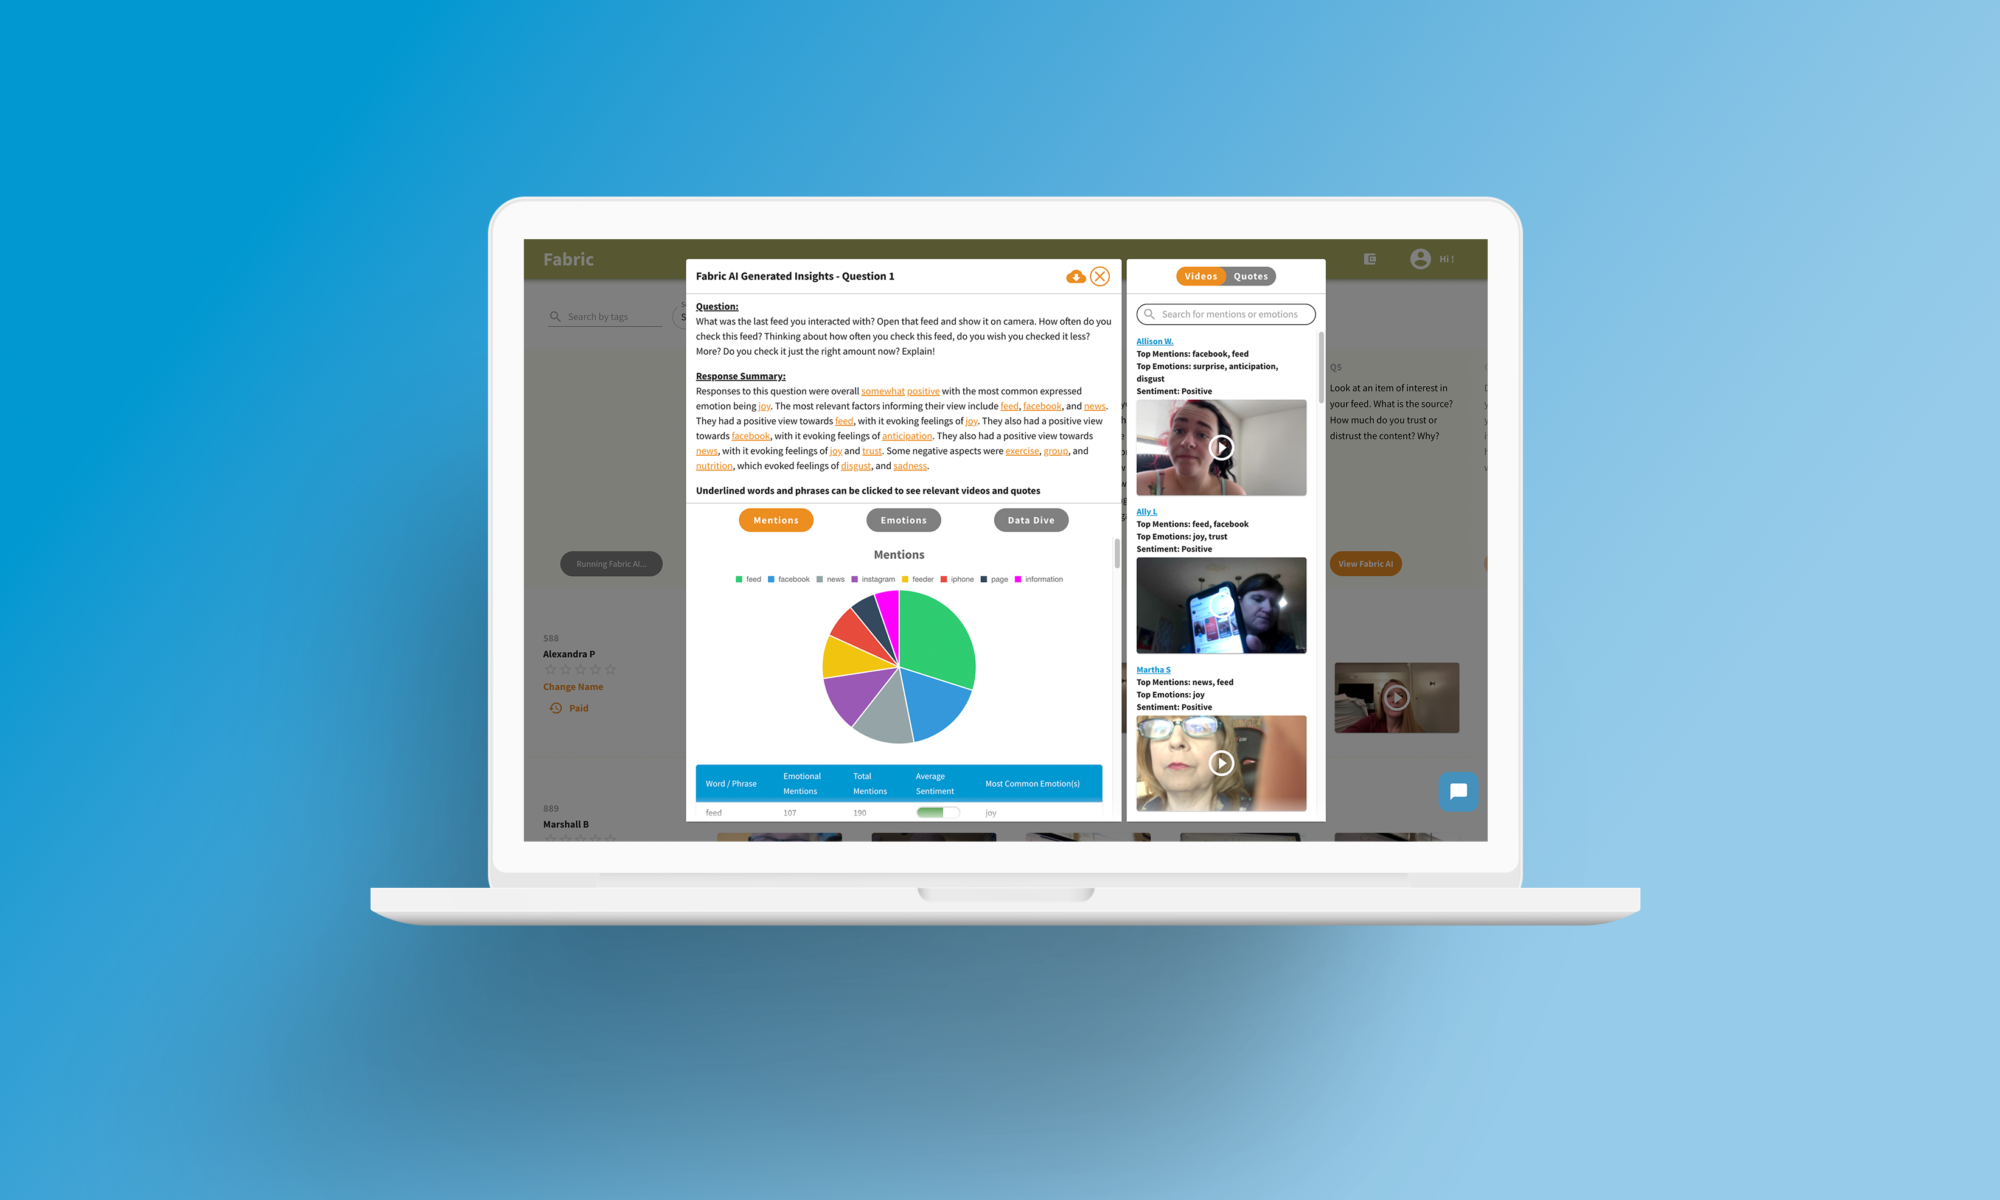
3. Fabric AI —which is optimized for sentiment and emotion— offers a number of different ways to parse the data at the press of one button:
- It counts Mentions, Mentions with emotional intent, and identifies which Mentions align with the 8 primary emotions Fabric AI tracks
- It identifies themes and patterns to drill into
- Using a combination of voice intonation and the transcripts, it generates a view of how strong each of the 8 primary emotions is, per question
- It serves up the most emotionally engaged video responses – with a toggle to view verbatims instead
4. Each video can be shared (which he did with fellow remote team members, to get their comments), tagged, rated and comments added
5. The agency also put together a short highlight reel to bring the insights to life, adding title cards, B roll and music; ultimately bringing additional meeting theater into the final pitch presentation
Results
W+K was awarded the MLB business, helping it drive not only new top line revenue, but adding a prestigious and iconic brand to the agency roster.
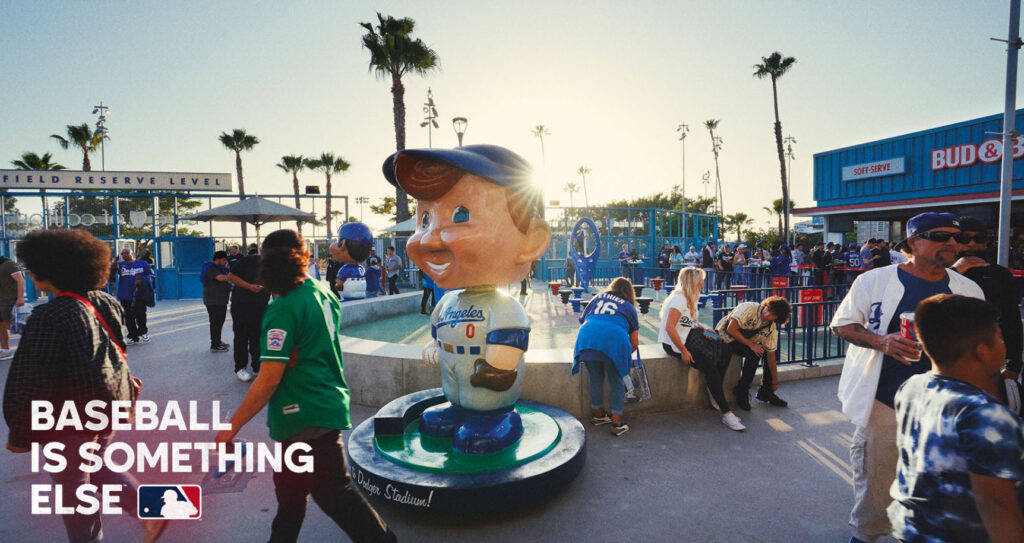
The launch campaign for Opening Day used the newly created tagline “Baseball is something else” which was a creative articulation of one of the strategic themes tested on Fabric.
The mass media coverage of the campaign and the social media buzz helped elevate MLB’s place in the cultural conversation, and opening day shattered the previous one day viewership records by a whopping 42%!
Says Anthony looking back on the pitch: